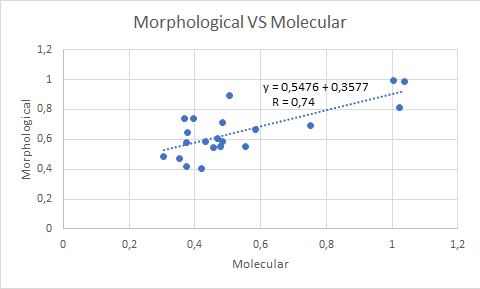
Correlation between the diatom Ecological Quality Ratios (EQR) based on molecular (x axis) and morphological (y axis) EQR for all samples. The linear regression model is represented by the dotted line, and r value is indicated. EQR values are in the range from 0 (bad quality status) to 1 (high quality status).